Overview
PJL Fitness Dashboard Overview Video
PJL Fitness Dashboard Demo and Walkthrough
Every PJL Fitness user has access to a fitness dashboard that automatically compiles metrics when workouts and movements are added to your fitness journal. As part of the beta-release, PJL has created visualizations for the most commonly asked questions, and we will continue adding new metrics and functionality as PJL Fitness matures. This page describes the metrics, features, and behaviors associated with the user dashboard.
Access
Users can access the metrics by clicking the ‘Dashboard’ link in the application sidebar, or by navigating directly to the dashboard if you have an account and are logged in.
Metrics
Current Workout Streak
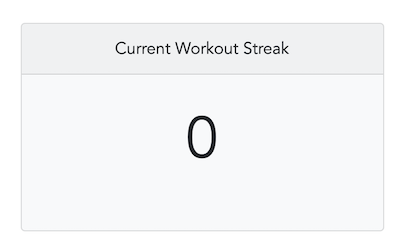
The ‘Current Workout Streak’ metric keeps track of the number of consecutive days you’ve logged a workout as of either the day you view it or the previous day (whichever is greater).
For example, when you create your account you’ll have zero logged workouts and your current workout streak will be zero; however after you add your first workout, your current workout streak will be one. If you add a workout the following day, your current workout streak will be two, but if you don’t, it will reset back to zero until you add your next workout.
Note that the current workout streak is not affected by the dashboard timespan selection.
Behaviors
All workouts are created equally in the eyes of this metric. The only criterion for a workout to be counted is that it is logged with the appropriate date.
This means that a mobility workout such as a yoga class, or active recovery workout such as a swim are counted the same as a high-intensity workout.
Intention
The intention of the current workout streak metric is twofold:
-
User Motivation - Streaks are inherently motivating. Knowing how well you’re doing provides an added incentive to continue. Unfortunately most people forget how many days in a row they’ve done something after only a few days. This metric remembers for you, ensuring you get credit for everything you’ve done provides you an accomplishment you should be proud of.
-
Enforces Exercise as a Conscious Effort: Because all types of logged workouts count equally (i.e. mobility, low-intensity, recovery, high-intensity, etc.). Users can keep streaks active without spending hours at a gym or attending a high-intensity class. This cultivates a more reasonable and sustainable approach to health and wellness that is predicated more on movement than effort.
Workout Logged
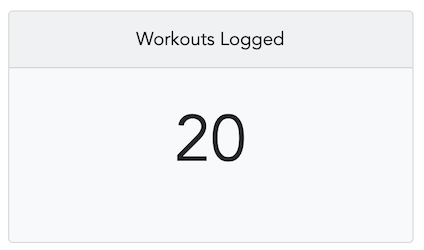
The ‘Workouts Logged’ metric keeps track of the cumulative number of workouts logged over a designated timespan. Each individual logged workout is counted irrespective of whether or not additional workouts were logged that day. Therefore a day with three logged workouts would contribute three workouts to this metric.
Behaviors
All workouts are created equally in the eyes of this metric. The only criterion for a workout to be counted is that it is logged with the appropriate date.
Intention
User Motivation - It’s almost impossible to keep track of how many workouts were performed in a month much less in the past six months. This is an important metric to track, however, because most people get a feeling of accomplishment from seeing how much work they’ve put in. PJL will do this tracking for you and make sure you can check at any time.
Max Workout Streak
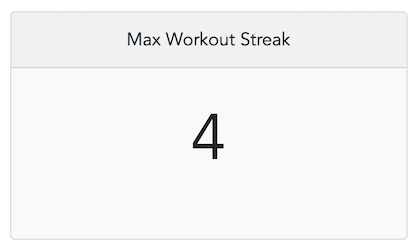
The ‘Max Workout Streak’ metric keeps track of the maximum number of consecutive days you’ve logged a workout over a designated timespan. If your current workout streak is also your max streak, these metrics will be equal.
Behaviors
The max workout streak is equivalent to the max current workout streak over the selected timespan. This means that the current workout streak will be less than or equal to the max workout streak, but never larger.
Intention
User Motivation - The max workout streak provides a benchmark goal for users to try and meet or exceed.
User Validation - The max workout streak provides users validation for their previous accomplishments.
Workout Distribution
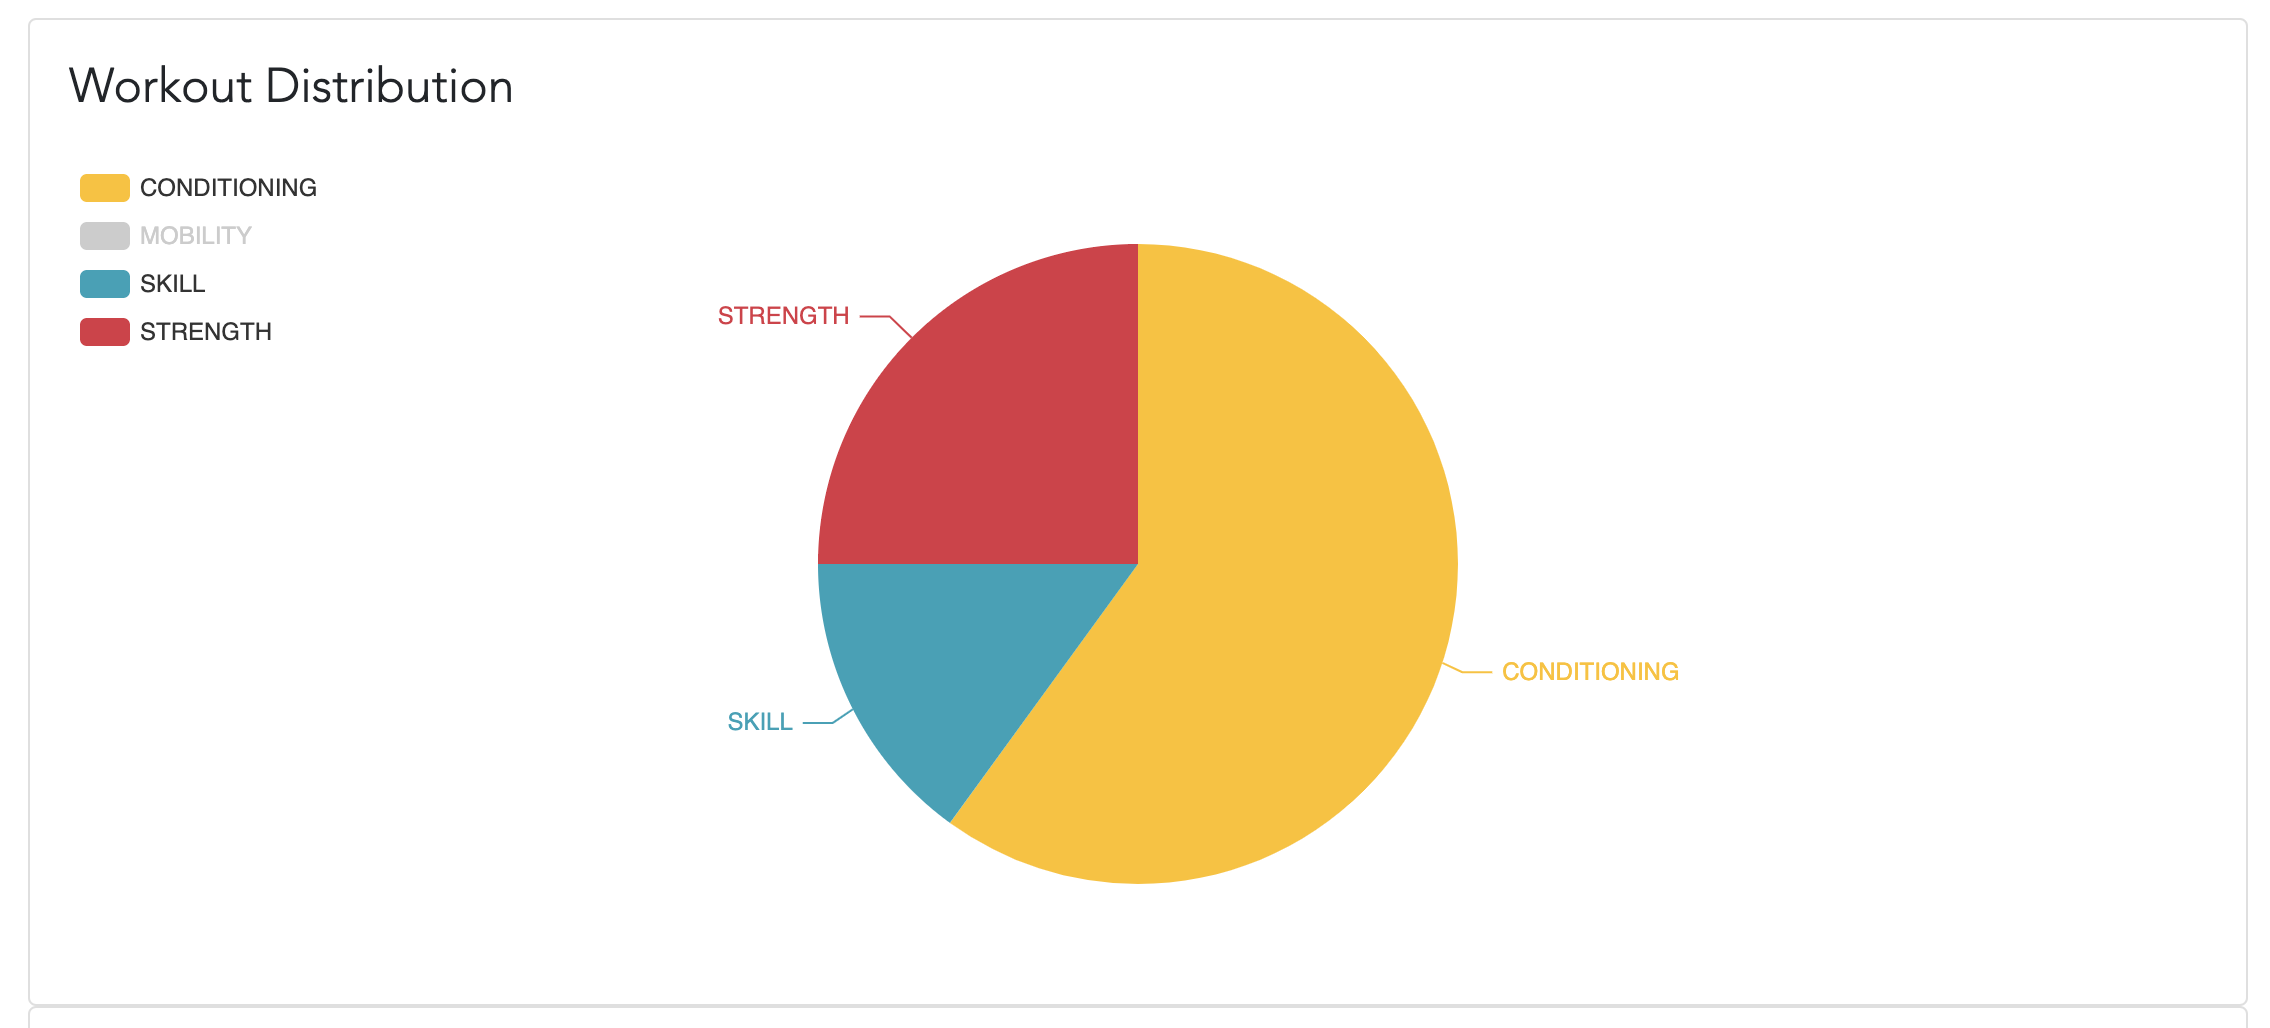
The ‘Workout Distribution’ visualization is a pie chart that aggregates the type of workout performed of a selected timespan.
Behaviors
Users can click or hover over a slice of the pie chart to see how many workouts are in that chunk and what percentage of the total that chunk represents. The sum of each chunk will equal the workouts logged metric.
Intention
The intention of this visualization is to give users a quick birds-eye view of the types of workouts they have done over the selected time period.
Workouts per Week
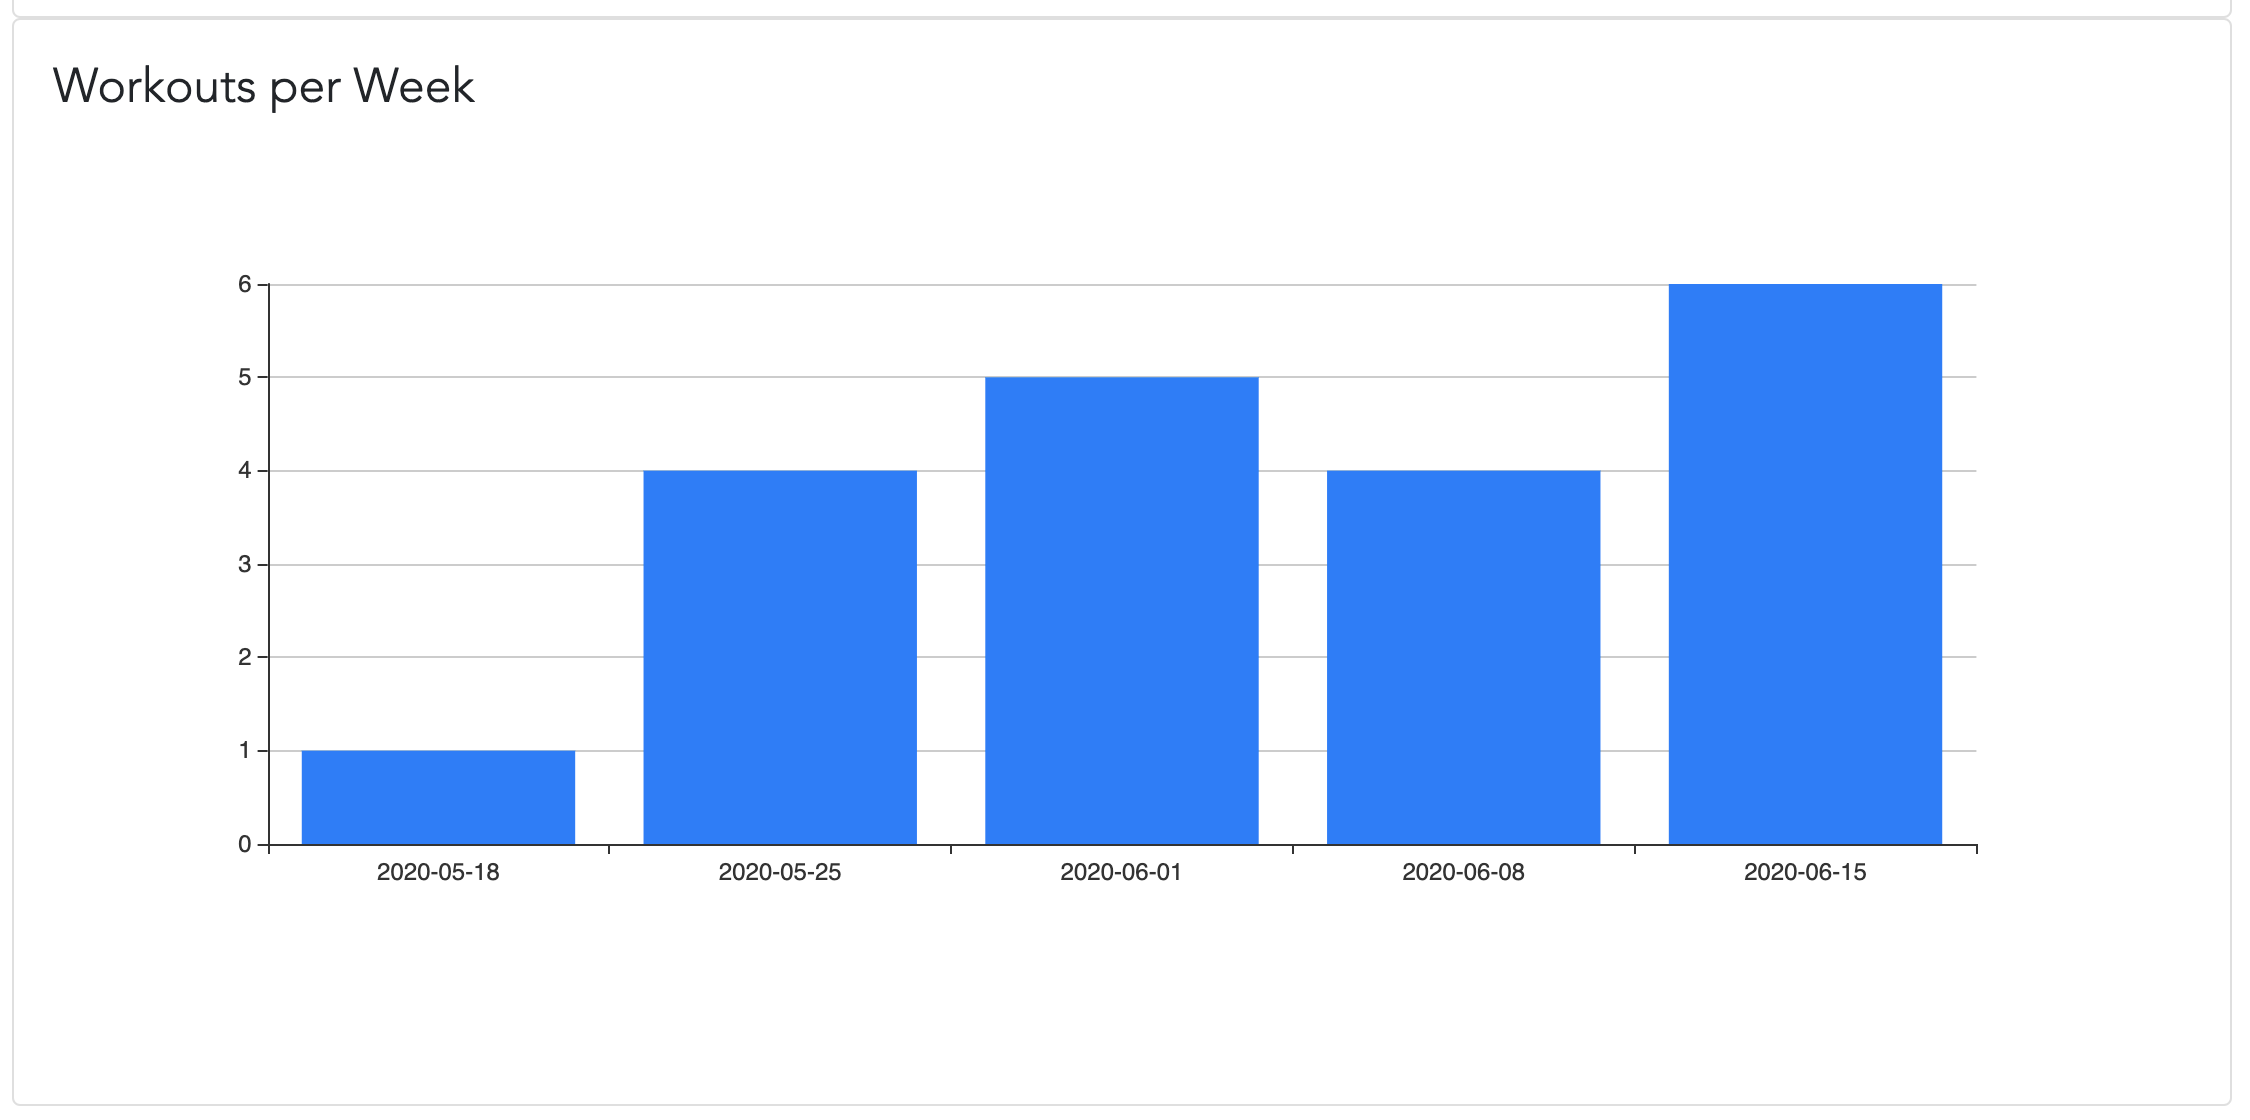
The ‘Workouts per Week’ visualization is a bar chart that aggregates the number of workouts performed in a given week over the selected timespan.
Behaviors
Users can click a bar, or hover, to see the exact number of workouts for that week. Note that if a week has zero workouts, it will not be shown. The sum of each bar will equal the workouts logged metric.
Intention
The intention of this visualization is to give users a quick overview of how their workouts are distributed across weeks.
Movement Progress
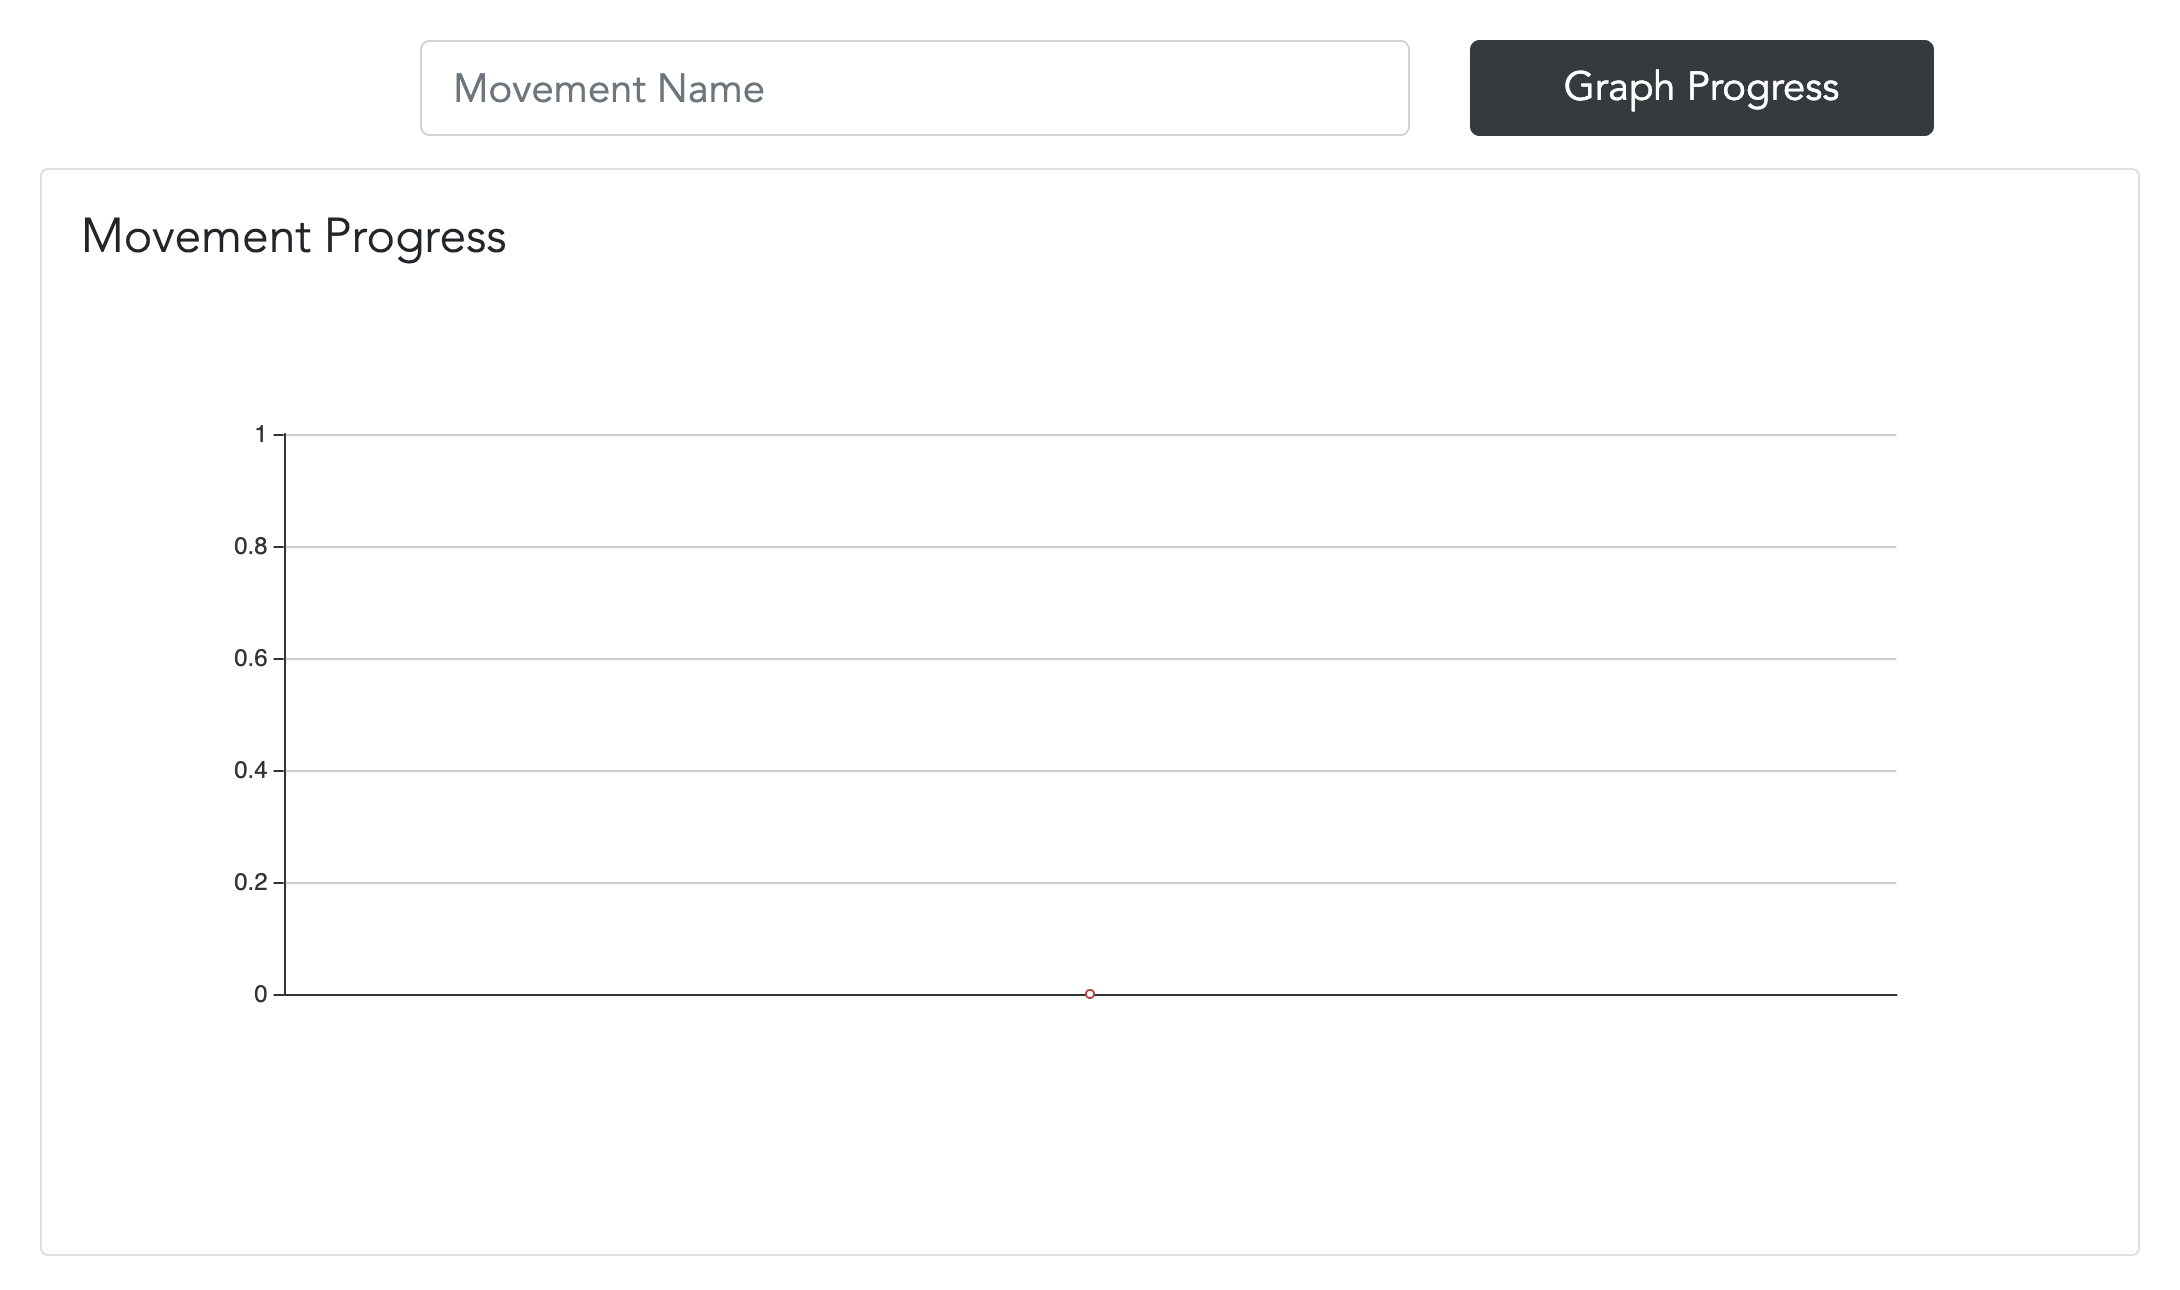
The ‘Movement Progress’ visualization allows users to track the weights used for a particular movement across logged workouts. Note that the selected time span does not affect this visualization; the entire workout history is searched.
Please note that this visualization will only chart weight. If a movement does not have a weight associated with it, nothing will be shown. There are plans to support tracking movement progress in other ways than weight, but weight is the only supported movement property at this time.
Behaviors
Although anything can be typed into the movement name input, the movement name input comes with a typeahead search to help select a valid movement to graph. The search matches against all possible movements regardless of whether the movement has a weight associated with it. Therefore if you type in ‘swi’, select ‘swim’, and click ‘Graph Progress’, the results will likely be blank because most people do not swim with weights.
Intention
Many users like to see their progress in terms of being able to handle increased weight across movements. This visualization gives users an easy way to see their strength progress over time.
Workout Progress
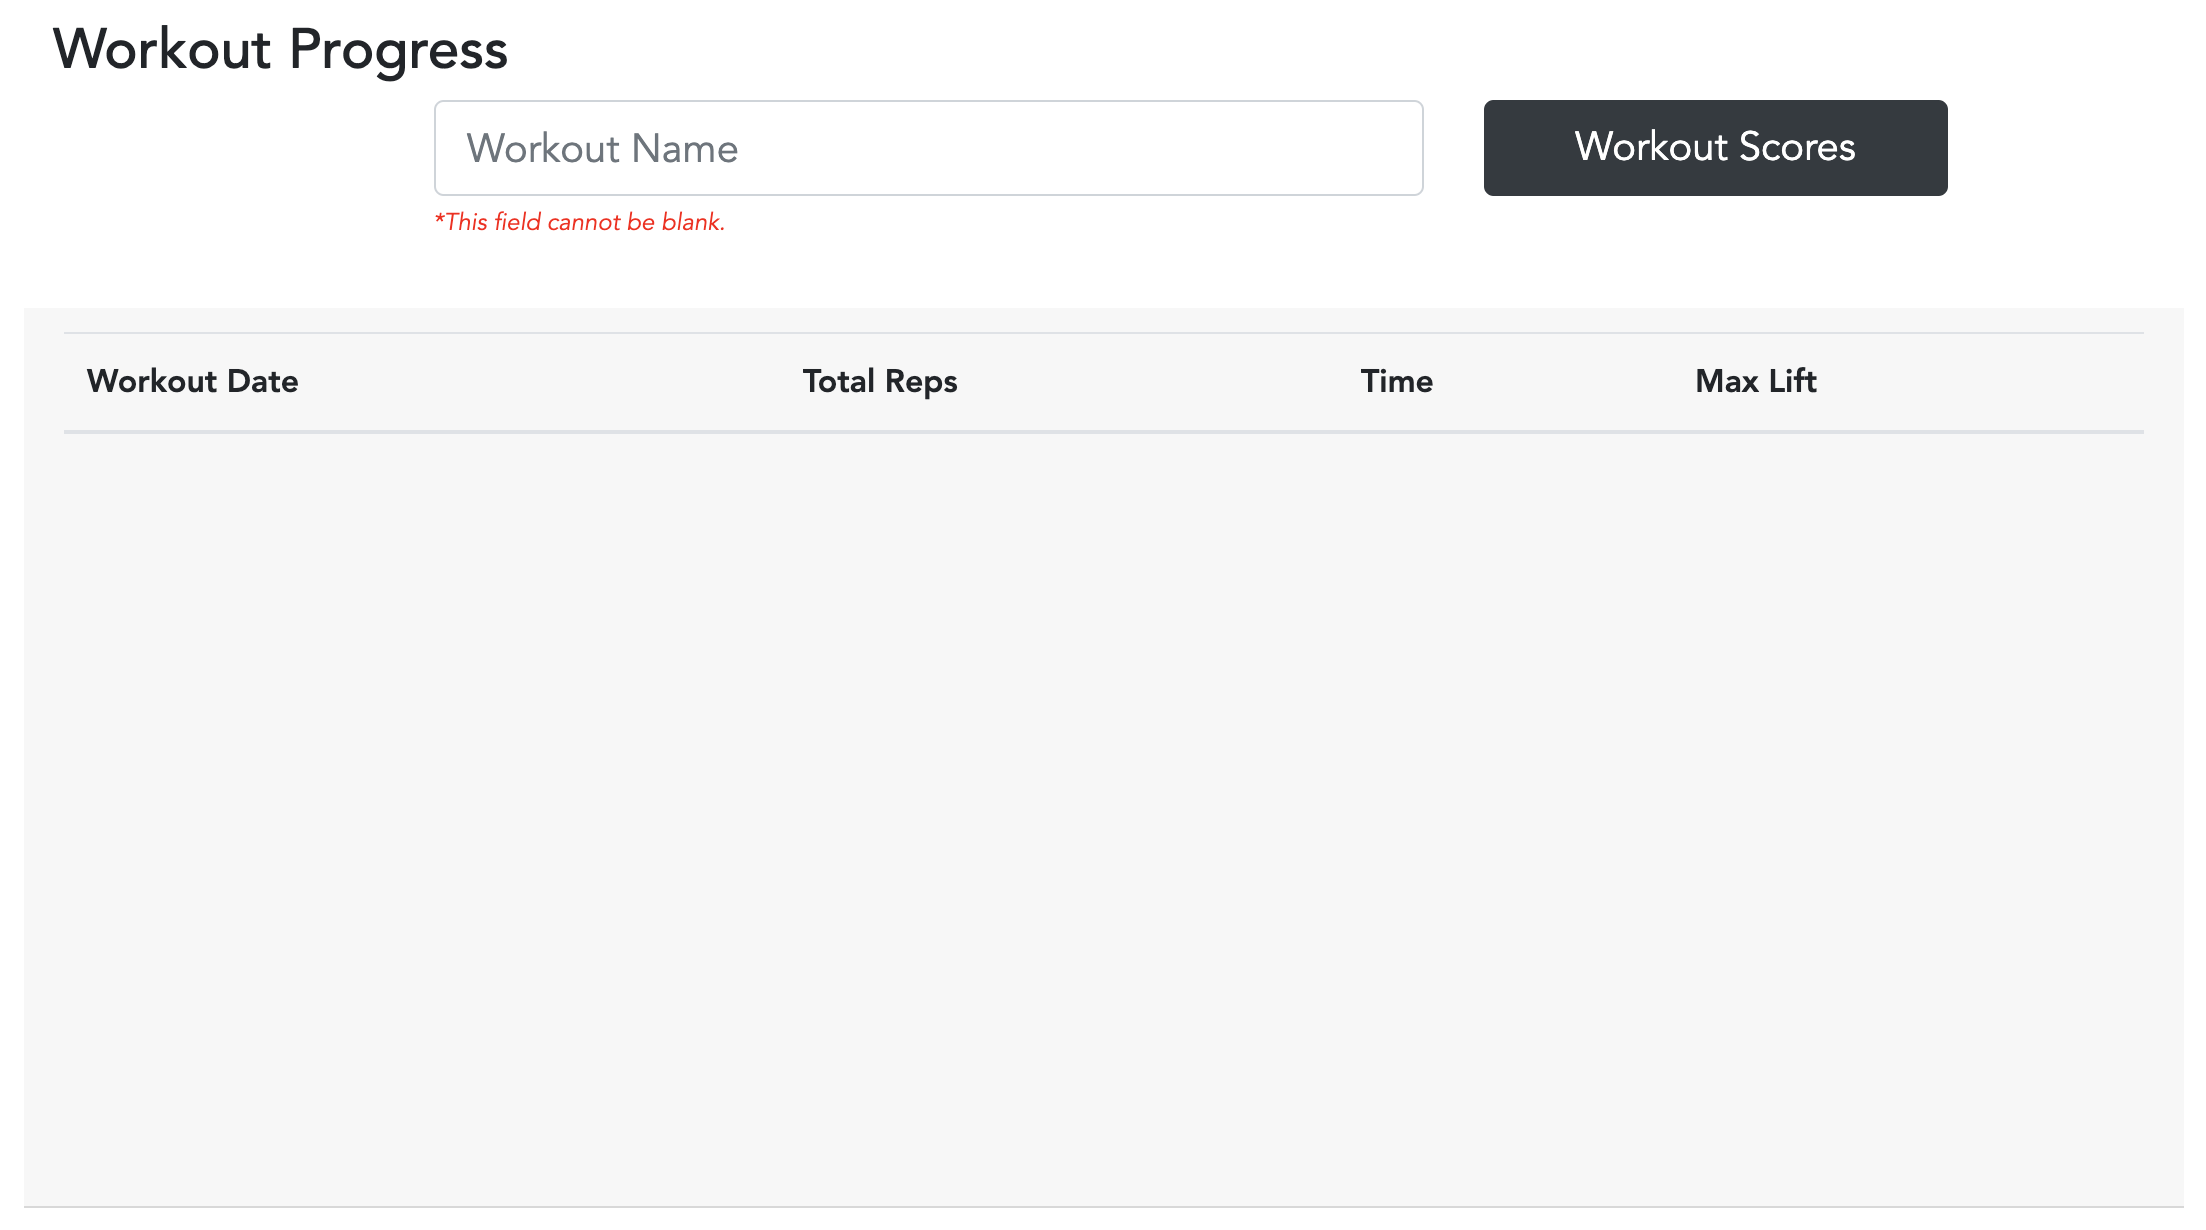
The ‘Workout Progress’ visualization allows users to track the workout results over time. Note that the selected time span does not affect this visualization; the entire workout history is searched.
Behaviors
Although anything can be typed into the workout name input, the workout name input comes with a typeahead search to help select a valid workout name. The search matches against all existing workout names associated with a user’s logged workouts. The resulting table will show workout scores associated with that workout if any have been provided.
Users can click the workout date value in the table to open the specific workout.
Intention
The intention of this visualization is to easily track workout progress over time. A common way to benchmark progress is to redo a workout and compare the results. This table allows you to do that easily.
Features
Timespan

The workout dashboard timespan component allows users to quickly update the time period used to aggregate certain metrics. By clicking a different timespan, the applicable metric will update with the data for that particular period.